XD1+ SOFTWARE TUTORIAL

ANALYSE YOUR DATA

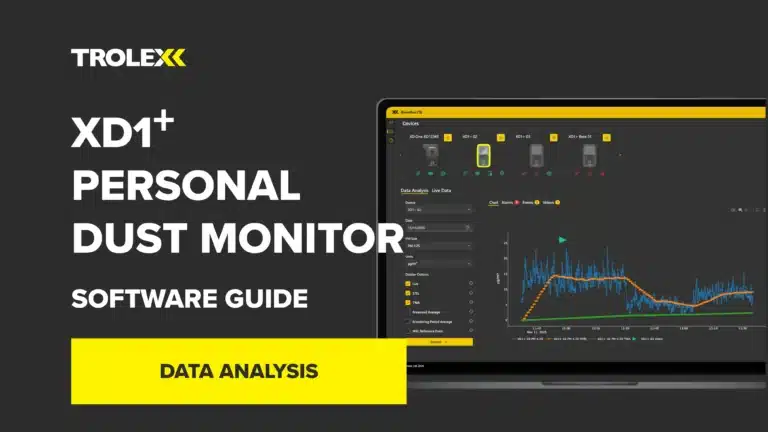
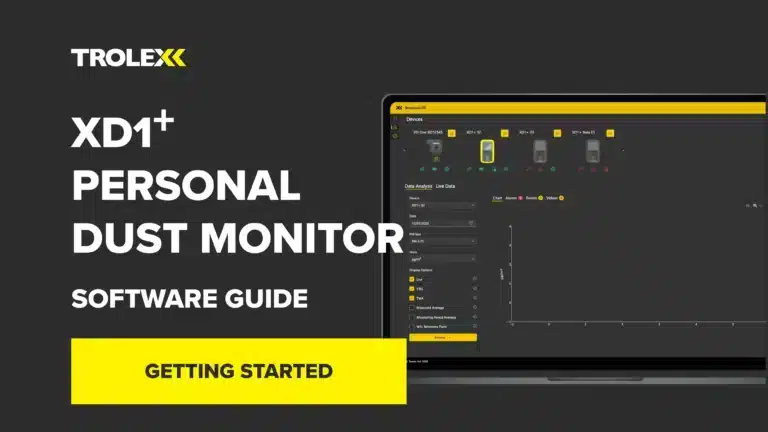
  1. After data has been downloaded from a device, the data can then be analysed by the steps below: 
  2. Navigate to the Data Analysis tab. 
  3. From the Devices drop down menu, select the XD1+ device that you wish to view data for. 
  4. Once the device has been selected, chose the correct date for which the data was collected, by clicking on the Date drop down menu and select the desired date. The calendar only displays dates for which data is available. 
  5. Choose the relevant particle size you wish to view for, from either PM1, PM2.5, PM4.25, PM10.  
  6. Choose whether to view this data in µg/m³ or mg/m³ by selecting the relevant option in the Units drop down box. 
  7. Choose which chart options you wish to view, from the following: 
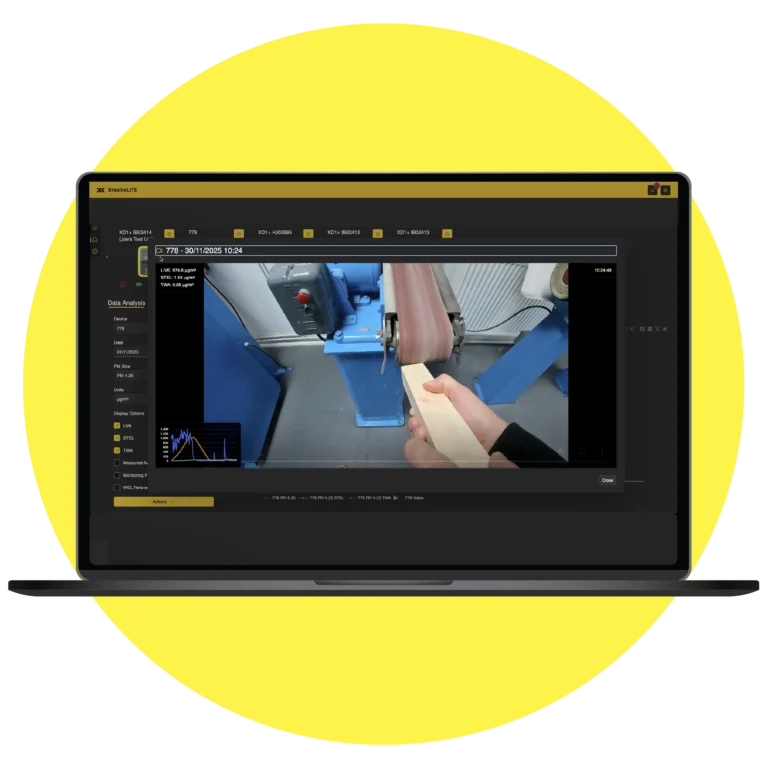
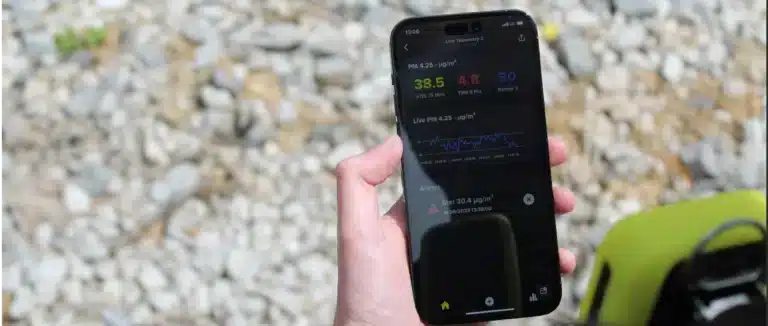
    • Live: particulate concentration is the real-time measurement of particulate levels, recorded every 10 seconds. 
    • STEL: represents the average particulate concentration over the most recent 15-minute period, calculated from the Live readings at each point in time. 
    • TWA: is the average particulate concentration over the monitoring period, adjusted to an 8-hour reference. If the monitoring period is shorter than 8 hours, the remaining time is assumed to have zero exposure. 
    • Measured average: is the cumulative average of all Live particulate concentrations from the start of the monitoring session up to the current point in time. 
    • Monitoring period average: is a fixed calculation of the average particulate concentration across the entire monitoring period, once the session has ended. 
    • WEL reference point: Workplace Exposure Limit is the legal concentration of airborne particulate plotted against Live readings. 
  8. To view the chart, click on the Actions button and select View Chart. 

ADVANCED DATA ANALYSIS MODE

If the normal data analysis view doesn’t fit your needs, you can enable the Advanced Data Analysis Mode feature, in the app settings. Once enabled, you’ll be able to select multiple devices and view data over a range of data. To view the chart:

  1. Select a device or multiple devices from the Devices drop down menu. 
  2. Next select the Start Date and End Date for the time period you wish to view. 
  3. Choose which particle size you wish to view, for either PM1, PM2.5, PM4.25 or PM10. 
  4. Choose whether to view the data in µg/m³ or mg/m³ by selecting the relevant option in the Units drop down box.  
  5. Choose which chart options you wish to view. 
  6. View the chart by clicking Actions and select View Chart. 
BreatheLITE Data Analysis tutorial: Advanced analysis mode

CHART OPTIONS

 Once a chart has been displayed on the screen, there’s a list of icons that are displayed in the top right-hand corner as shown below, these are: 

  • Save the current chart as a PNG file. 
  • Zoom into the chart; click and hold the left mouse button to zoom in on the chart. 
  • Pan around the chart; click and hold the left mouse button to pan. 
  • Draw a box on the chart. 
  • Draw a lasso on the chart. 
  • Click and zoom into the chart. 
  • Click and zoom out of the chart. 
  • Auto scale. 
  • Reset chart axis. 
BreatheLITE Data Analysis tutorial: Chart options

EXPORTING DATA

 To export the data from BreatheLITE to a delimited file format for use with apps such as Excel, follow these steps: 

  1. Navigate to the Data Analysis tab. 
  2. From the Devices drop down menu, select the XD1+ device you wish to export data for. 
  3. Once the relevant device is selected, choose the relevant date by clicking on the Date drop down menu and selecting the desired date. 
  4. Choose which particle size you wish to view for from PM1, PM2.5, PM4.25 or PM10. 
  5. Choose to view the data in either ug/m3 or mg/m3. 
  6. To finish exporting the data, click on the Action Button and select Export to Delimited File. The data will then be exported into the following directories, and the file will also be displayed on the screen: 
  • Windows – C:\ProgramData\BreatheLite\Data 
  • Mac – $UserDirectory\.BreatheLite\Data 

You can also do the same when exporting data into an Excel file, by following the same steps, then selecting Export to Excel. 

BreatheLITE Data Analysis tutorial: Exporting data to delimited file

GOT PRODUCT QUESTIONS?

If the Trolex XD1+ STEL and TWA indicators are flashing red as shown below:

This means the Trolex XD1+ has detected an electronic failure of the internal memory. The XD1+ will alert the user and enter an error state.

If this happens, please contact our support team to raise a ticket.

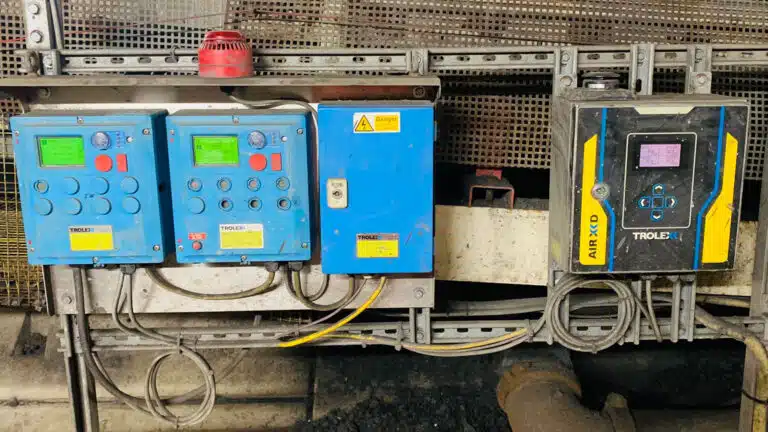
AIR XD operates a protective thermal cut-out sequence when the temperature inside the instrument exceeds the maximum operating temperature of 45 °C.

This protective measure is in place to maintain the lifespan and operating functionality of the optical sensor assembly when the AIR XD is installed in environments with high ambient temperatures.

If the internal temperature of the instrument is suspected to be below -10°C, for example, if it has been left powered off for a period of time in a very cold environment, damage to the optical assembly may occur when power is applied.

Allow the instrument to reach safe operating temperature before applying power.

If all three device indicators are flashing red as shown below, this means the device has a non-recoverable operating error. 

If this is happening to your Trolex XD1+ device, please contact the Trolex service team to raise a new support ticket

Our AIR X Particulate Monitors don’t hold any of these accreditations.

No. The Group I manual states that the USB connector on the base of the equipment shall only be connected to the Trolex TX8805 AIR XD USB Drive in the hazardous area.

USB drives with no power source, such as standard USB sticks, may be connected to the USB connector in the safe area for test purposes.

AIR XD is designed to allow infrequent pressure washing during maintenance schedules, but the inlet cap must be closed first.

Keep an appropriate distance between the pressure washer and the instrument, and do not direct the water jet at the underside of the instrument because water must not enter the air flow path.

Yes. The AIR XD provides in and out RS485 terminals so multiple MODBUS devices can be daisy-chained.

Some network installations may require a termination resistor across RS485 lines A and B.
SEE MORE RESOURCES

PARTICULATE MONITORING

Image of TX8061 XD1+ Personal Dust Monitor
TX8061 XD1+ Personal Dust Monitor

Image of TX8005 AIR XD Dust Monitor
TX8005 AIR XD Dust Monitor

Image of TX8100 AIR XS Silica Monitor
TX8100 AIR XS Silica Monitor

Image of AIR X Software
AIR X Software

AIR X NEWS + UPDATES

GET AIR X NEWS + UPDATES

    You may unsubscribe from these communications at any time. For more information on how to unsubscribe, our privacy practices, and how we are committed to protecting and respecting your privacy, please review our Privacy Policy.